Prior to the onset of the novel coronavirus pandemic in February 2020, David Menival, directeur de la Filière Champagne chez Crédit Agricole du Nord Est, a major lender to both growers and producers in the Champagne region in France, was worried about the future of the industry in his region:
The growers, many of whom make their living by selling the majority of their grapes to the houses, but including a significant number of higher profile producers elaborating, marketing, and selling their own distinctive styles of Champagne to wide critical acclaim, are expecting the same or similar yield to that of 2019, but climate change is reducing yields. The négociant houses have been hit by short-term cash flow problems due to lack of sales, and the growers see their overall assessment of the future market as unduly pessimistic.[1]
According to Menival and several small independent producers, the French Champagne industry in 2020 was characterized by different positions of the two main factions in Champagne, the growers who own 90 percent of the nearly 34,000 hectares of productive vineyard, and the négociant houses who account for the vast majority of sales, especially the more profitable business outside France, but only own a tenth of the vines. The industry faced three major challenges:
-
global warming;
-
changing consumer tastes and demographics; and,
-
changing retail channels, as a result of the emergence of direct sales and consolidation among retailers.
OVERVIEW
Champagne from France competed in a category of sparkling wines that represented diverse production methods and branding. Included in this category were méthode champenoise wines from other wine growing regions, such as those in Australia, U.S., Spain, and South Africa, as well as charmat method wines, such as prosecco from Italy Eand sekt from Germany. Since the Great Recession (2008–2010), prosecco had made major inroads into the global sparkling wine market, with a top share of eight percent, while global share of Champagne had peaked in 2014 and 2018 at 3.2 percent, according to data compiled by Statista in 2019.[2]
As a means of adding value to Champagne as a region beyond just the sale of wines, industry observers at both the Burgundy and NEOMA business schools believed that, as in other wine regions of the world, coordinated tourism strategies there could well be beneficial to improve Champagne’s market share, image, and cash flows by targeting both domestic and foreign tourists. A comprehensive regional tourism strategy might involve restaurants, other providers of the hospitality industry, and perhaps other tourist attractions beyond wine.[3]
Champagne was the seventh largest wine-producing region in France in terms of area. Similar to Bordeaux and Burgundy, Champagne was considered a mature wine-producing region, in that the value of its wines were considered relatively stable.[4] From 2018 to 2019, Le Comité Interprofessionnel du vin de Champagne (CIVC) reported a global decline in Champagne volume sales (-1.7 percent vs. +0.4 percent in 2016–2017) and an increase in value (+3.4 percent vs. -0.6 percent in 2016–2017), on the back of falling British exports and a weak French market. Industry analysts viewed the decline in Champagne consumption over 2016–2017 as a result of a weak consumer outlook and intense export competition from other sparkling wines, such as Italy’s prosecco.[5]
According to figures released by the Federation of French Wines and Spirits Exporters in February 2018, exports reached a record high in 2017. Export sales climbed by 8.5 percent to reach €12.91bn, with wine sales recording their first increase in five years.[6] The U.S., U.K., and China represented the top three export markets for French wines and spirits. In 2018–2019, owing to political instability and economic woes, France no longer retained its title as the major market for Champagne sales by volume and value, as shown in Exhibit 1.[7]
The Champagne region value chain
It took 15 months to produce a non-vintage Champagne and three years to produce a vintage Champagne (from raw grapes to commercialization). Champagne houses usually signed four-year contracts with vine growers.[8] There were three different types of actors in the Champagne region: growers, cooperatives, and houses (producers). Some growers sold all their grape crops, some sold part of their crops and retained the rest for their own brands, while some sold no crops and either grew or purchased grapes to produce their own brand.
Champagne producers purchased grapes from vine growers in anticipation of the demand for bottles of the wine three years in the future, meaning that there was a lag as supply adjusted to demand. Annually, negotiations took place between the representatives of grape growers and Champagne producers. As a result of the negotiations, growers and producers collaborated to adjust supply in the short run by deciding on the optimal harvest volume (in kilograms per hectare), and in the long run by entering into agreements about vineyard planting.
The territoriality of the Champagne region led to both grower-producer cooperation and competition:[9]
… the production structure of Champagne is complex. Historically, as in much of Europe, grapes have been grown by many small, agricultural producers (the “growers”), of which there are currently about 15,000 in the region, and together they own 90 percent of viticultural land.
However, most of the Champagne sold worldwide (two-thirds, including 80 percent of all exports), is produced by larger companies (the “houses” or négociants), who make the most well-known brands, such as Moët et Chandon, Perrier Jouët, and Taittinger.
Additionally, there are a number of growers’ co-operatives, which also produce large brands. Further, nearly one quarter of all sales are made by the growers themselves, although 90 percent of their market is domestic rather than export. Thus, the houses rely on the growers and co-operatives for the supply of grapes and wine for their champagne, yet at the same time are in competition with them for market share [Charters et al. (2013): 1508–1509].
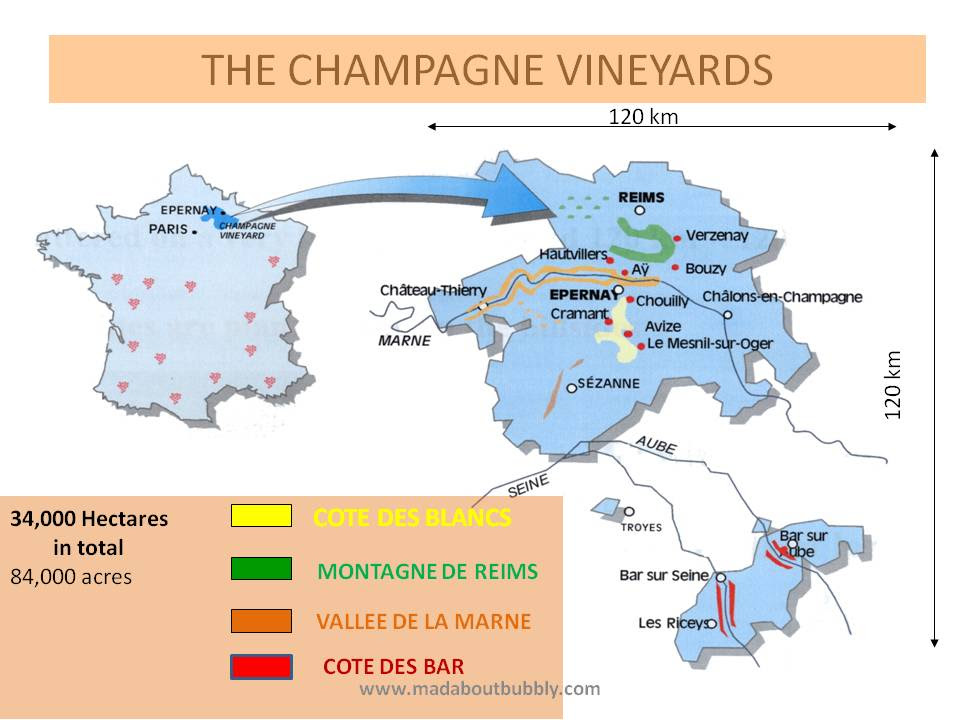
Unlike many still wines, which were grown in a specific vineyard, one of the traditional strengths of Champagne was the fact that 93 percent of the product was based upon a blend of wines made from different grape varieties grown in different vineyards in different parts of the Champagne region. See Exhibit 2 for a map of the Champagne region.

A major reason for blending was to ensure stability and consistency, even in years when inclement weather led to attenuated grape production or the quality of the harvest was not considered by producers to be great. The major disadvantage of blending was that the character of the individual components in the blend was lost.[10]
Climate change in the Champagne region: challenges and responses
The Champagne region boasted the lowest average temperatures of all of the French wine regions. Many observers, however, opined that the impact of rising temperatures could be viewed as broadly positive, creating riper, more approachable wines, and decent crop sizes. According to Bloomberg’s industry analyst Elin McCoy, in the Champagne region, buds were appearing earlier than in the past, so spring frosts were more destructive to young vines. Warmer nights were not only accelerating grape maturity but also fostering new pests and diseases.[11] The 2018 and 2019 harvests came early—the third and fourth harvests in the last 16 years where picking had begun in August—prompting renewed concerns about the potential effects of climate change on the Champagne vineyards in the years to come.[12] Growers lost 10 to 11 percent of the potential harvest through sunburned grapes in 2019.[13] In late June 2019, the highest temperature ever recorded in Champagne was reached, 42.9 degrees Celsius (over 109 degrees Fahrenheit). Some analysts and producers worried that weather conditions could become increasingly difficult in the next 30 to 40 years.
According to wine writer Eric Asimov in The New York Times, owing to global warming, places, like England, that were historically unsuited for producing fine wine were given the opportunity to join the global wine world, transforming local economies in the process. Legendary French houses, which had nervously been giving English sparklers the side eye for close to a decade, started moving into the U.K. Taittinger and Vranken-Pommery invested millions of dollars planting vineyards and setting up production in England. The land was cheaper, the soil was similar, and the climate was ideal. In fact, many claim the terroir in England today was analogous to Champagne’s in the 1970s, the period the region reached its peak in terms of quality.[14] Currently, 2,000-plus acres specifically for sparkling wine were under vine in England, with thousands more planned, compared with France’s 76,000 acres devoted to Champagne grapes. As of 2017, there were 503 commercial vineyards and 133 wineries producing five million bottles of wine in England, a marked increase from three million bottles in 2011. This amounted to a 66 percent increase in five years. More than 4,940 acres of grapes were being grown there, a number that has doubled in the past 10 years and was projected to grow another 50 percent by 2020. Of the wine produced, 66 percent was sparkling (24 percent was still white and 10 percent was red or rosé). Within the sparkling category, Chardonnay, Pinot Noir, and Pinot Meunier accounted for more than 50 percent of the varietals used (being the three authorized grape varieties used in the Champagne region to make Champagne).
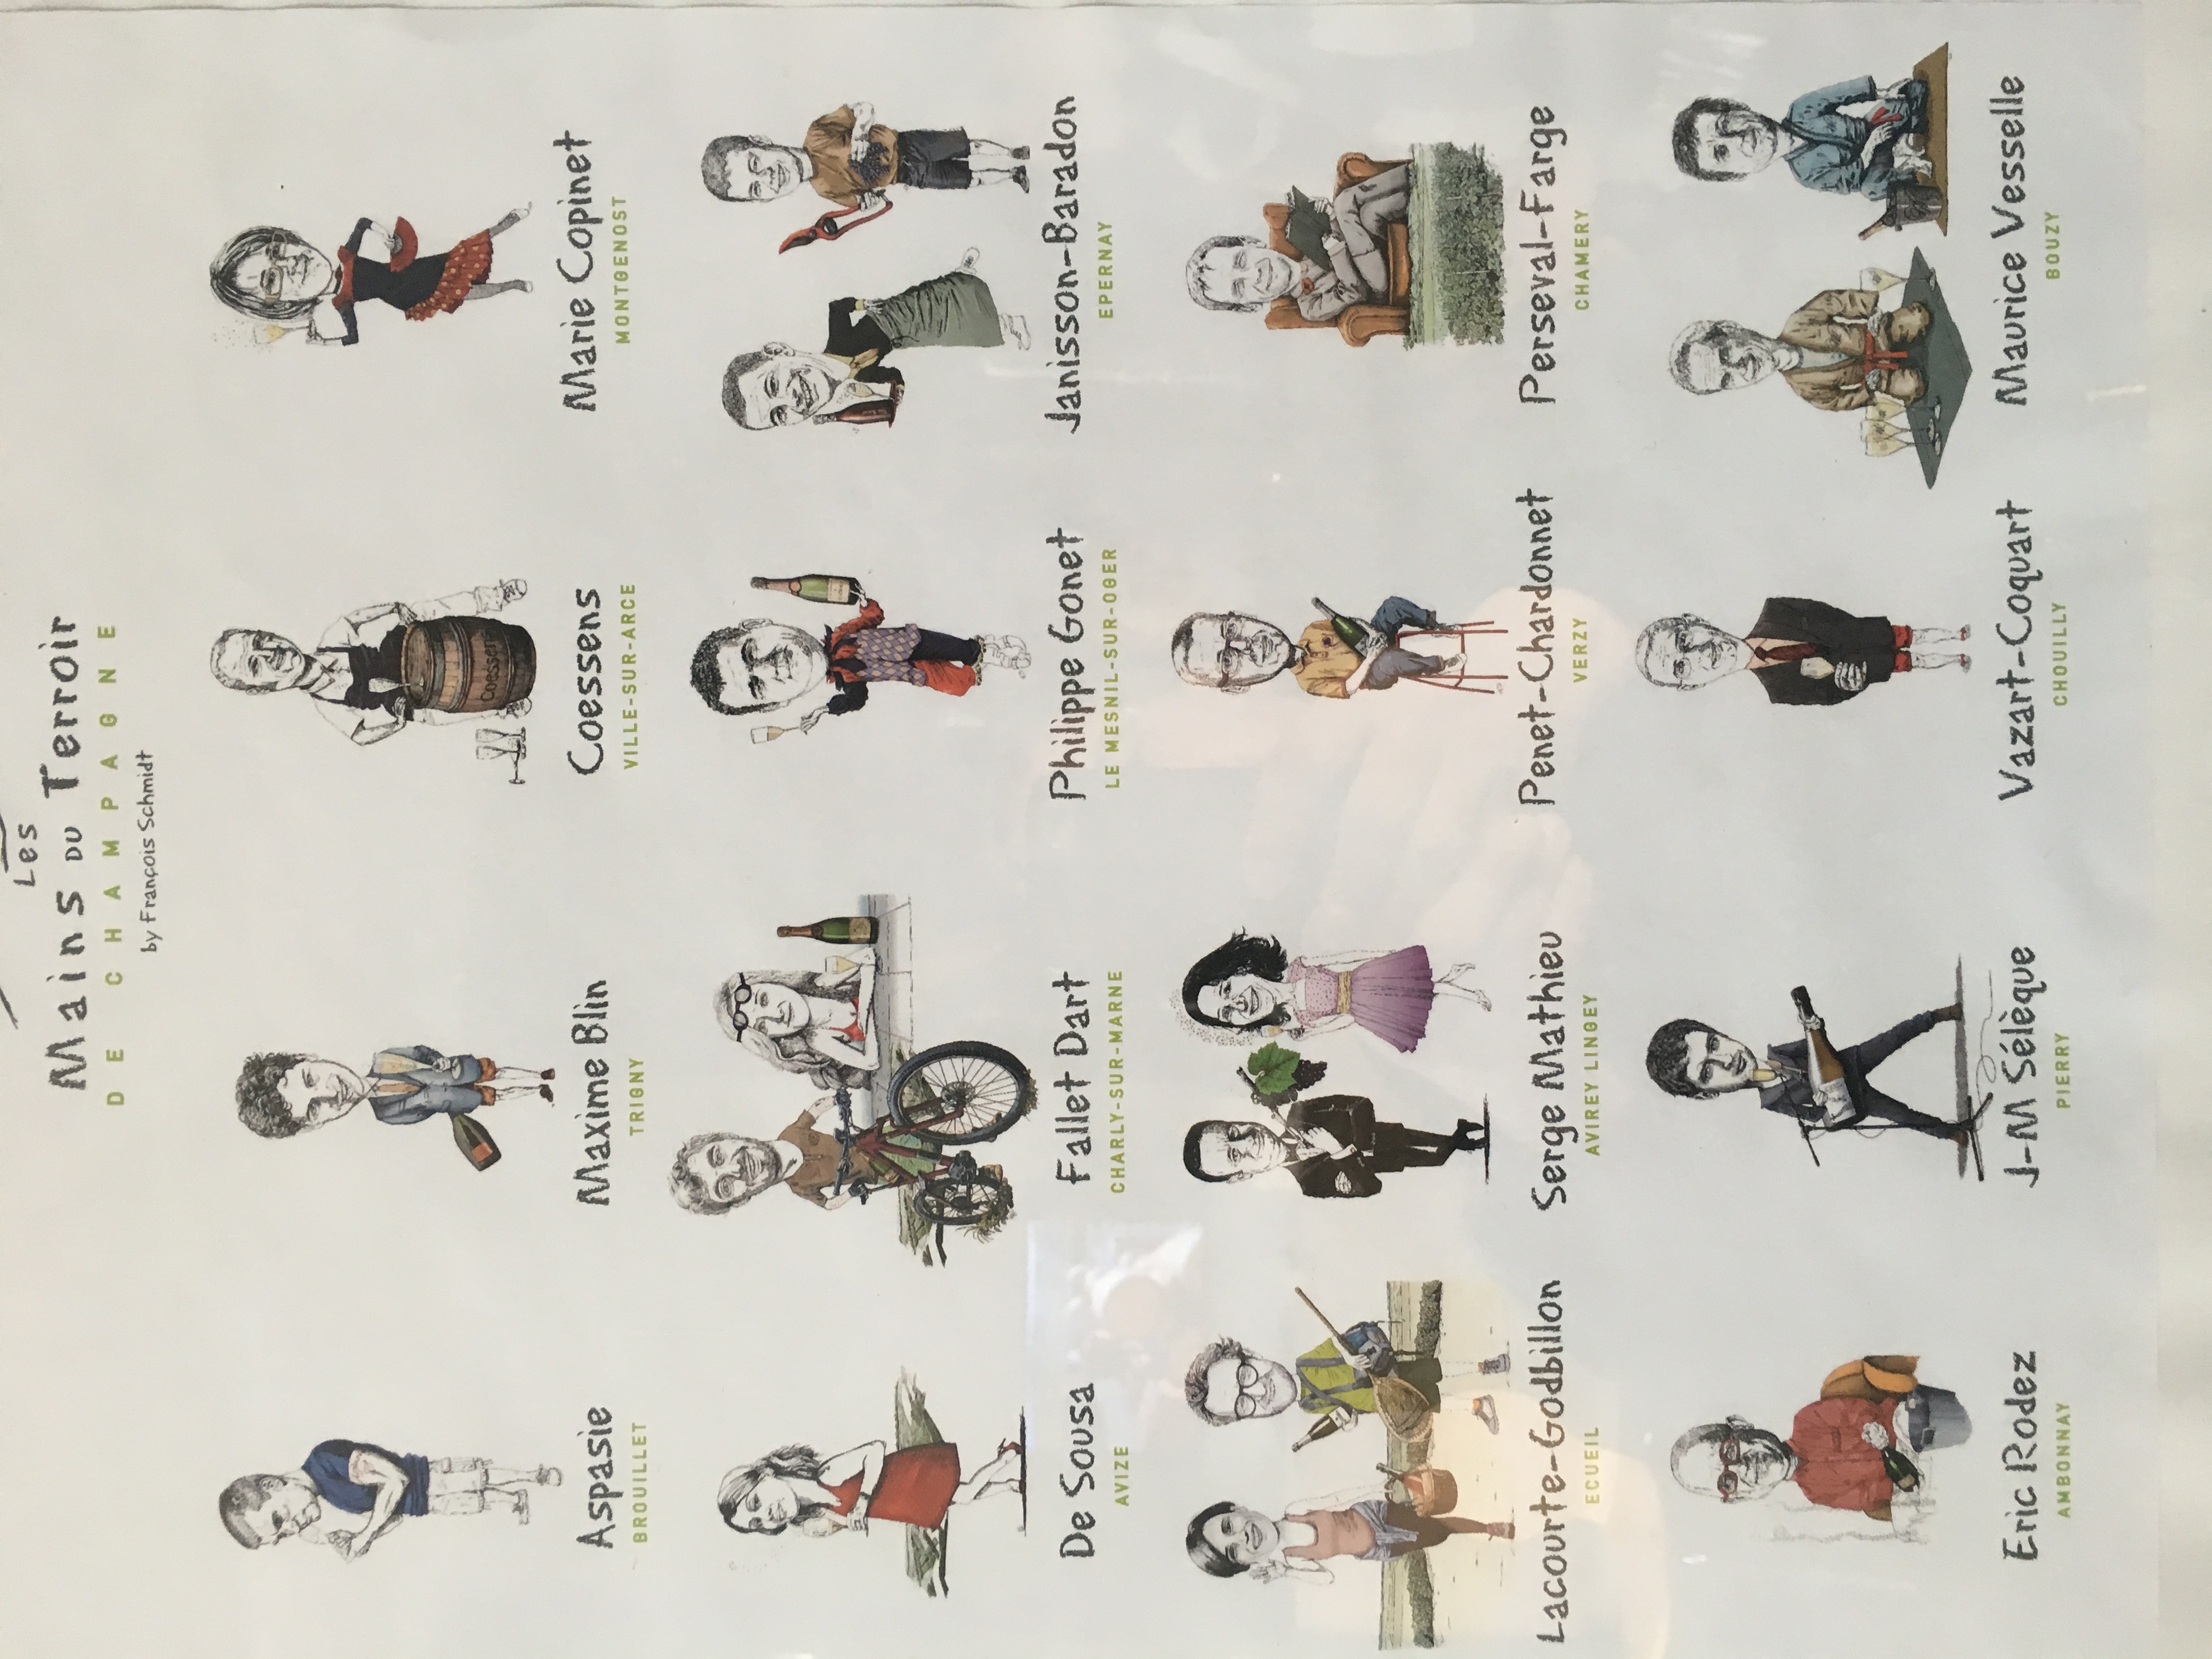
Some artisan Champagne makers felt that they had another solution for an uncertain future in the region. While these small producers represented less than one percent of the total Champagne produced, they had created an informal alliance of twelve houses that had come to be known as Les Mains du Terrior. Alexandre Penet was the owner of La Maison Penet, a small Champagne producer that owned vineyards in Verzy and Verzenay, two small villages in the Champagne region. M. Penet reported that he, along with several other artisan Champagne makers, “[were] often influenced by winemaking practices in Burgundy, [but] had recently decided to produce Champagnes from one particular plot in order to provide Champagne lovers with a new experience and a unique insight into the diversity to be found in Champagne.”[15] See Exhibit 3 for a pictorial list of these producers.

Production
The production of Champagne began with the harvest in late summer, before the harvest for other types of wine. The preferred grape varieties for Champagne were Chardonnay and Pinot Noir (along with Pinot Meunier in the Champagne district of France). These grapes ripened slowly in cooler Northern vineyards and were picked early while total acidity was high and sugar content was low. Hotter summer spells from global warming increased the sugar content in some grape varieties, reducing the need for adding sugar. Wines were then blended in order to achieve a consistent flavor profile and level of quality from year to year. This was known as the “cuvée” wine and was moved to a large tank where sugar and yeast were added. The mixture was then drawn off into bottles and capped with a crown cap made out of stainless steel. Bottles were laid on their side as the second fermentation took place in the bottle and allowed the bubbles to develop.
After a period of several years, the Champagne was prepared for completion. The dead yeast in the bottle was removed in a process known as “riddling.” Bottles were slowly turned upside down and rotated in stages, so the yeast sediment moved into the neck. The material in the neck was then frozen. When the cap was removed, the yeast popped out of the bottle. The wine was adjusted for fill level and sweetness before the cork was applied to complete the process.
The méthode champenoise process described above spanned several years, required much hand labor, and utilized costly grapes, so these products tended to be quite expensive. Two other methods were developed in order to supply a lower priced product.
The first was the transfer process. After the second fermentation, instead of performing riddling to collect the yeast sediment, the bottles were emptied into a tank and clarified in bulk. This became less popular as machines began automating the riddling in most modern operations (Baldy, 1997).
The second was the charmat bulk process. It was generally used to make simple sparkling wines for the lower price category. The second fermentation took place in tanks instead of individual bottles. The yeast was removed by filtering, and the product went to market much more quickly.
The importance of place of origin
There was a long tradition of relying on place of origin to serve as a cue in ascertaining the quality of a wine, especially when buyers were unable to actually taste the wine. There was a growing body of evidence that both country and region of origin had become important information as consumers made wine purchase decisions. Researchers have found that one third of respondents reported that place of origin was a consideration in wine purchasing.[16] Country and region of origin followed only brand as indicators of quality in a survey analysis originally performed in 2008 and replicated for verification in 2016.[17]
Territorial branding emerged as a way to differentiate sparkling wines and attach a greater price premium to those wines. In 2017, a team of researchers at the University of Adelaide, Australia, found that country or region of origin was important in consumers’ purchase decisions for sparkling wines, most often linked to the Champagne product.[18] Consumer respondents in this research investigation reported purchasing different sparkling wines for different occasions, implying that producers and marketers could benefit from developing a range of brands catering to diverse purchasing preferences, different price points, and unique situations.
Many sparkling wine consumers were willing to purchase premium brands such as Champagne, but only for special occasions and as gifts. Most sparkling wines were purchased for off-trade consumption that was sold outside of restaurants, hotels, and cafés. Yet, Champagne consumption in France and elsewhere around the world was facing changes in the luxury market, according to Spielmann & Williams (2018):
The emergence of accessible luxury created a “new normal” trend of consuming luxury products as an everyday occurrence, often motivated by advertising messages and sales promotions with appealing price-to-quality ratios. Accordingly, Champagne producers faced stiff competition from non-Champagne sparkling wines such as cava [from Spain], prosecco [from Italy], and sparkling wines from the United States, Australia, and New Zealand. This trend had been exacerbated by the promotional strategies of competitive products and producers who used extreme discounting to eat away at the Champagne category. There was also an increase in the purchase of various other regional French sparkling wines: Crémant from the Burgundy, Alsace, and Jura regions; La Clairette de Die and Blanquette de Limoux from the South of France; and Vouvray and Mountlouis Pétillant from the Loire region. All of these products created a cannibalizing effect on the Champagne category. Non-Champagne sparkling wines accounted for 65 percent of all sparkling wines consumed in France. While the average price for a bottle of Champagne hovered around €20, the average price paid for a bottle of non-Champagne was around €6. (Spielmann & Williams, 2018, p. 6)
Exhibit 4 provides Euromonitor International’s estimates of what percentage of sparkling wines were sold by channel and by region, from 2012 to 2017. Exhibit 5 tabulates Euromonitor International’s estimates of the volume in million liters of all sparkling wines sold by region from 2012 to 2017.
COMPETITION
France’s alcoholic drinks industry boasted some of the world’s most prominent manufacturers, with many operating across multiple alcoholic beverage categories. The sector’s largest Champagne manufacturers included two publicly traded French companies: the LVMH Group (Champagnes Moët & Chandon and Dom Pérignon) and Pernod Ricard (Champagnes Perrier-Jouët and Mumm). Comparative contemporary financial and operating data for these two companies are tabulated in Exhibit 6.
LVMH
LVMH Moët Hennessy Louis Vuitton was a manufacturer and retailer of luxury goods. LVMH manufactured and marketed Champagne and wines, cognac and spirits, fashion and leather goods, perfumes and cosmetics, watches, and jewelry. LVMH was also engaged in selective high street and airport retailing. Its operations were organized along five business segments: Wine and Spirits, Fashion and Leather Goods, Perfumes and Cosmetics, Watches and Jewelry, and Selective Retailing. LVMH was also engaged in other activities, such as media with Les Echos group, Parisian department store La Samaritaine, and luxury yachts with Royal Van Lent. Other LVMH brands included Moët & Chandon, Dom Pérignon, Louis Vuitton, Fendi, Donna Karan, Parfums Christian Dior, Guerlain, Parfums Givenchy, and TAG Heuer.
In late 2017, Moët Hennessy USA launched a new interactive “skill” on Amazon’s digital assistant Alexa, called Bottles and Bubbles. This initiative was aimed at providing consumers with the opportunity to learn about Champagne and request food pairings and tips in their own homes. LVMH Group’s wines and spirits business saw an increase in revenue growth of five percent in 2016. Profit from recurring operations increased by 10 percent and volumes increased by three percent. The company reported that Champagne and prestige cuvées had performed particularly well in 2017, and that Hennessy cognac enjoyed 10 percent year-on-year volume growth. However, its cognac and Champagne businesses remained dependent on the supply of grapes from restricted regions, so yields remained limited.
Pernod Ricard
Pernod Ricard produced and distributed wines and spirits: aniseed products, vodka, whisky, cognac, rum, gin, liqueurs, Champagnes, and wines. Its activity was organized around families of products built around brands. Its brands portfolio included: ABSOLUT vodka, Ricard pastis, Ballantine’s, Chivas Regal and The Glenlivet Scotch whiskies, Jameson Irish whiskey, Martell cognac, Havana Club rum, Beefeater gin, Kahlúa and Malibu liqueurs, Mumm and Perrier-Jouët Champagnes, as well as Jacob’s Creek and Brancott Estate wines (the latter two brands were rumored to be for sale in late March 2019). Pernod Ricard was structured into four segments constituted by the following geographic regions: France, Europe (excluding France), Americas, and Asia/Rest of the World. Pernod Ricard’s premium wine brands, including key strategic brands Jacob’s Creek, Campo Viejo, Brancott Estate, and Kenwood, accounted for around five percent of the group’s sales, with a growth rate of two percent in financial year 2018, compared to a four percent growth rate in 2017, according to industry analyst Arabella Mileham, a reporter for Drinks Business. Champagne brands, Mumm and Perrier-Jouët, remained outside the company’s premium wine brand division.
Cava production in Spain
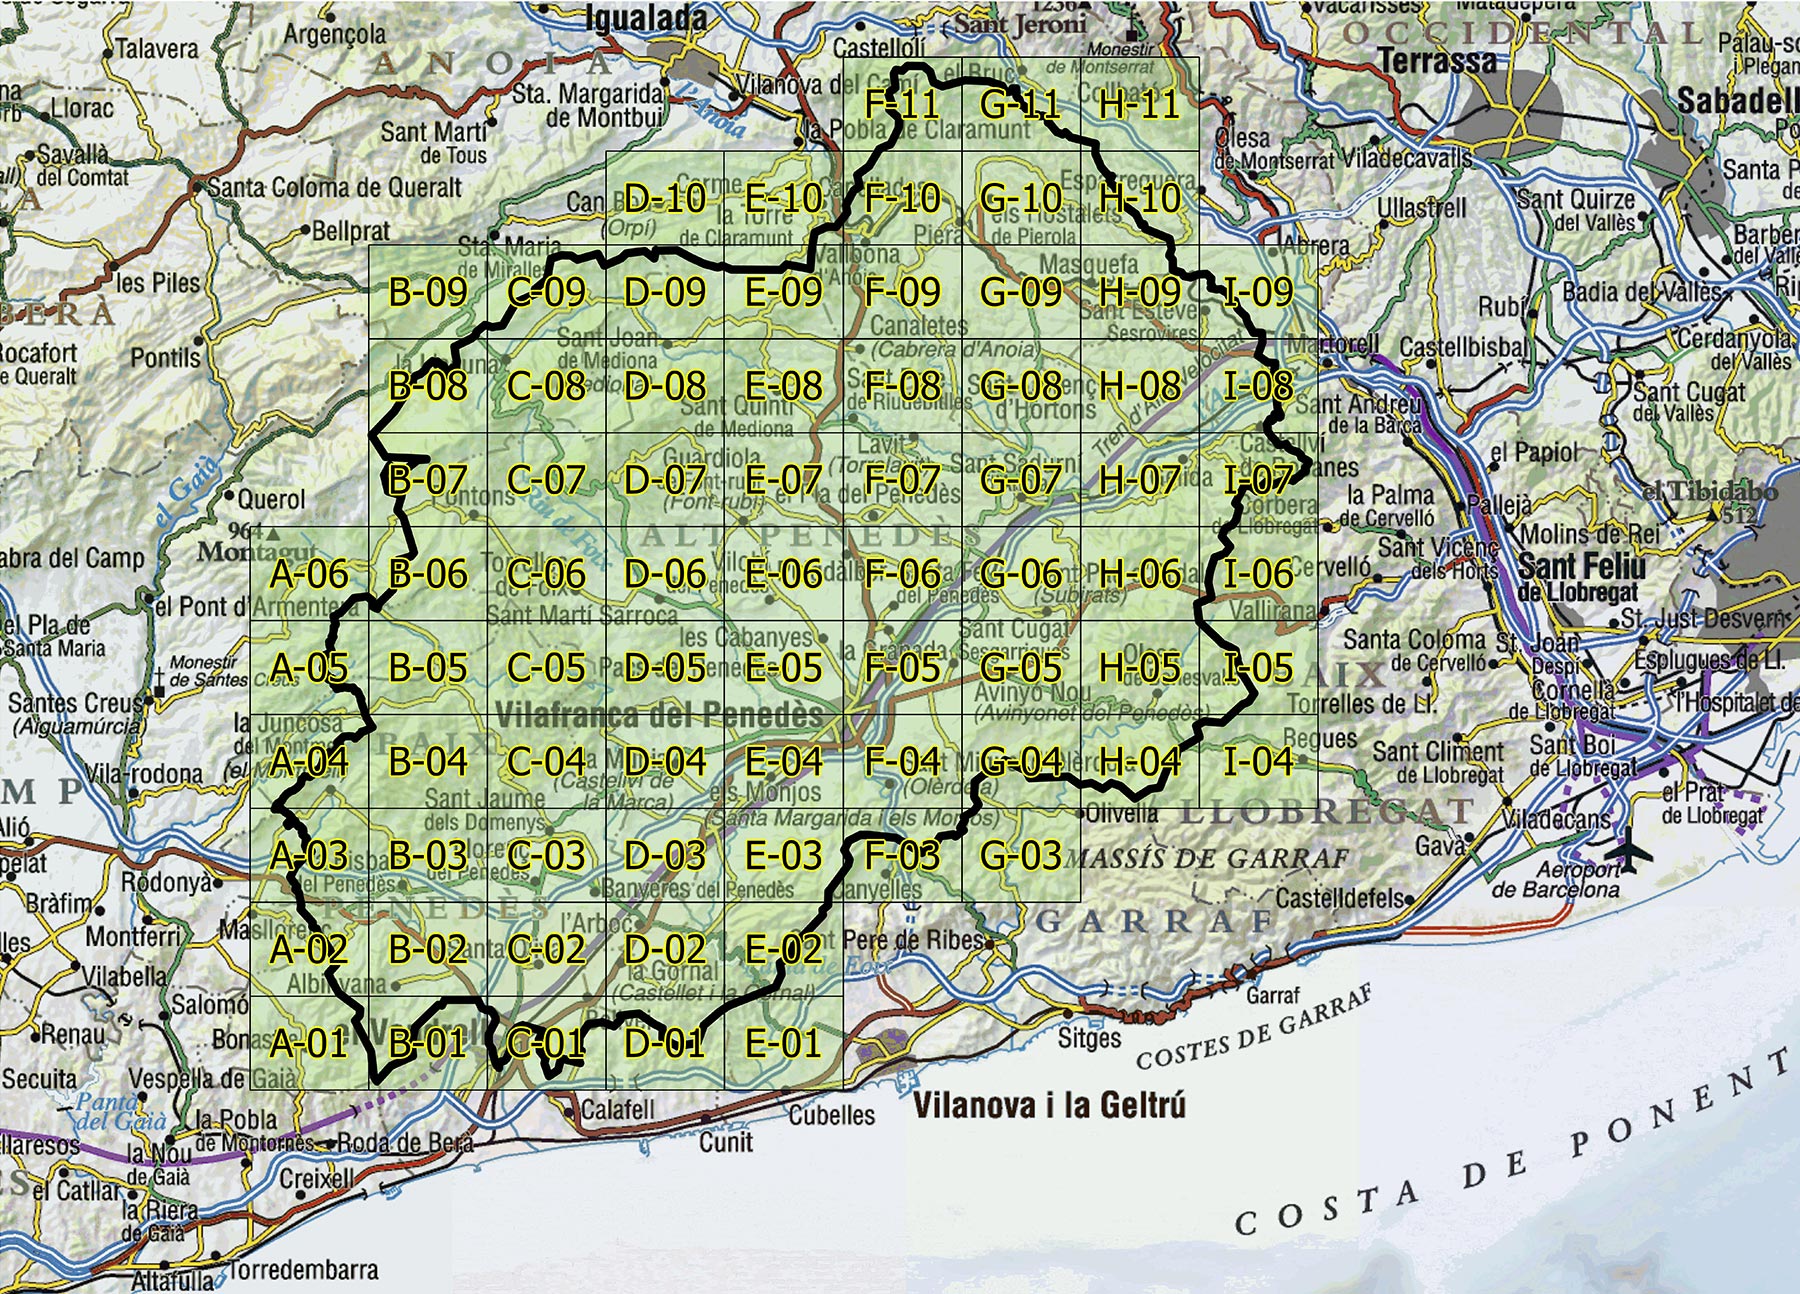
In January 2019, five Spanish cava producers broke from the Penedès Denominación de Origen (D.O.) to form Corpinnat, “a collective Union brand established with the aim of distinguishing great sparkling wines made in the heart of the Penedès from 100 percent organic grapes, harvested by hand, and entirely vinified on the premises of each winery.”[19] Corpinnat (the heart or “cor” of Pinnat—the Catalan name for the Penedès region near Barcelona, Spain) was a micro D.O. representing a cooperative brand of sparkling wine made according to a set of five criteria. As of September 2019, Corpinnat was a cooperative of nine wineries that made a commitment to meet the following production criteria:
-
Terroir—located in a local area (map shown in Exhibit 7) in the heart of the Penedès valley between the mountain and the coast;
-
organically and biodynamically grown grapes must be used in production;
-
wines must be fermented for a minimum of 18 months or less (compared to the nine months minimum for cava);
-
producers must “vinify” their own grapes exclusively; and,
-
a minimum of 75 percent of the grapes used in production must be grown in the area (can be sourced under long-term contracts with other growers).

According to Ton Mata, managing director of Recaredo, a cava producer in Penedès:
There is such pressure on the area to change, but we have to change within the industry if we are to protect the growers. Corpinnat is the way forward for us five producers, or we die from competition with prosecco and Champagne. In 10–15 years, we hope to have 2,000 members.[20]
Sparkling wine production in the United States
Competition for sparkling wine was considered to be most intense in the United States, according to a 2019 report from Lettie Teague in the Wall Street Journal. Small wineries in Northern California, such as Flaunt Wine Company, as well as big names, such as Domaine Carneros, Domaine Chandon, E. & J. Gallo, Jackson Family Wines, Foley Family Wines, Louis Roederer, Piper Sonoma, and Schramsberg, were expanding production of sparkling wines using traditional Champagne methods. Sparkling wine production in California was being driven by rising sparkling sales in the United States, which had grown steadily since 2016. As of early May 2019, table wines led volumes lower while sparkling wine sales saw increases in both value (up 11 percent) and volume (up eight percent), based on Nielsen ScanData reported by Peter Mitham in Wine Business Monthly on June 18, 2019.
Several United States sparkling wine producers labeled their sparkling wines as “Champagne,” and the United States government allowed the use of the Champagne term on United States brands established on or before March 2006, as long as the geographic origin accompanied the Champagne term on the label, according to the United States Wine Institute.[21] New United States brands introduced after that date were not allowed to use the Champagne term. Traditional wine grape varieties used in California charmat sparkling wine and méthode Champagne production included Chardonnay, Pinot Noir, and Pinot Blanc, though many other varieties were also used, depending upon the style, production process, and price point.[22]
Comparative worldwide market shares of all sparkling wine producers in addition to the major French Champagne houses are shown in Exhibit 8. The top ten selling United States sparkling wine brands by volume are shown in Exhibit 9. The leading United States sparkling wines by method of production are listed in Exhibit 10. Exhibit 11 tabulates the top fifteen sparkling wines sold in the United States and includes imported brands. Exhibits 12 and 13 present volume shipments by producer to the U.S., from California and from outside California, respectively.
MARKETS FOR CHAMPAGNE
France boosted exports of wine and dairy products in 2017 and 2018, according to Mergent Online’s August 2018 Food and Beverage Report for Europe. Domestic consumption remained high despite slight food price inflation, with the average turnover index for food retailing at supermarkets in January through May 2018 being 98.32 percent compared with 96.48 percent in 2017, the French national statistics agency (INSEE) reported. There appeared to be growing demand for French foodstuffs and trade ties with other countries outside the EU, especially China.
Aviation retained its dominance as France’s largest export sector in 2018. However, the food and beverages sector represented not only France’s second largest export sector, but also her largest domestic employer, with some 500,000 workers, according to Euromonitor (2019). The food and beverages sector boasted an annual €10 billion (US$11.6 billion) trade surplus and exported primarily alcoholic beverages, particularly wines, in addition to groceries, dairy products, and meat, with EU countries among its top export markets. Food and beverages sector exports totaled US$23.8 billion in the first four months of 2018, up from US$19.7 billion a year earlier, Euromonitor reported in March 2019. Imports were valued at US$20.1 billion, an increase from US$17.3 billion in the corresponding period in 2017.
France held a position as the world’s second largest wine producer with a 36.7 million hectoliter output in 2017, just behind Italy, the International Organization of Vine and Wine (OIV) reported in April 2019. Additionally, the report stated that France exported wine and spirits worth €12.91 billion (US$15.04 billion) in 2017, representing an 8.5 percent rise from 2016. The United States imported €3 billion (US$3.5 billion) worth of the beverages, with cognac accounting for a 40 percent share, while China imported €1.2 billion (US$1.4 billion), according to the OIV report.
The OIV estimated that France’s organic wine output was valued at €670 million (US$905.6 million) in 2016, as exports of organic wines accounted for 24 percent of total wine export sales volume. Industry analysts predicted growth in demand for organic food and beverages, which would boost France’s organic segment of its food and beverages sector.
In 2018, sparkling wine once again saw the biggest growth among all table wine categories, both in terms of volume and total value, according to the OIV. The world sparkling wine trade accounted for nine percent of the volume of wine sold and continued to increase in both volume and in value (+3.7 percent and +6.3 percent, respectively, over 2017). A significant share of Italy and France’s exports by volume sold consisted of sparkling wines (20 percent and 13 percent, respectively). In terms of value, sparkling wines represented 20 percent of the value of all wines sold on the world market (despite representing only nine percent of the total volume exported).
In late 2018 and early 2019, France strengthened its ties with emerging wine-drinking nations, particularly China, to offset effects from anticipated trade difficulties with the United Kingdom following the outcome of the Brexit referendum, and to take advantage of China’s burgeoning trade dispute with the United States.[23]
The United Kingdom’s exit from the EU was accompanied by a new tariff regime, which was anticipated to take effect in 2021. Tariffs meant that wine exports to the United Kingdom, the leading export market for French Champagne, would become more expensive for France. Although still wines from France would be taxed at a rate of 10 British Pounds per hectoliter, the tariff on Champagne was set at 26 British Pounds per hectoliter.
Forecasted French domestic consumption of alcoholic and non-alcoholic beverages, by contrast, presented a mixed outlook, as shown in Exhibit 14. Forecasts for domestic purchases and consumption of most non-alcoholic beverages showed a compound annual rate of growth of nearly five percent from 2018 out to 2022, while forecasts for domestic alcoholic beverage purchases and consumption from 2018 out to 2022 were comparatively lower, ranging from 1.1 to 2.2 percent compound annual rates of growth.[24]
Speaking to the annual Wine Financial Symposium on October 2, 2019, Jim Clerkin, president and CEO of Moët Hennessy North America, commented: “People used to start with still wine and move to Champagne. Generation Z, they start with Champagne and maybe they move to still wine.”[25]
Wine tourism in Champagne
Wine tourists typically focused on a particular wine region, stayed in hotels or Airbnb lodging, then made one or, at most, two stops at a winery as part of their visits. Wineries provided guests with seated presentations that lasted much longer compared to the past, so there was considerably less time to visit many other wineries. Increasing tasting fees were also deterring casual consumers. According to a 2019 report from Silicon Valley Bank, most wine tourists planned and arranged visits in advance before they left home and were predisposed to buy before they walked into a tasting room.[26]
Researchers at the University of Reims surveyed 28 producers in the Champagne region in 2011, and noted some significant barriers to promoting tourism:
-
Small producers, all of whom sold wine from their domaines, often did not think that they were involved in wine tourism, nor did they perceive it to be part of an overall marketing strategy;
-
Many small producers felt that tourism was for others to undertake, such as high volume and internationally-recognized producers, local restaurants, or hotels and inns;
-
A theory that wine tourism could increase brand equity and could be a means of adding value was often not understood and wine producers were not entirely certain what their visitors wanted; and,
-
Generally, European producers had limited interest in attracting wine tourists except as a means of counteracting declining sales.[27]
Champagne had mostly been insulated from changing consumption and consumer demand cycles, at least thus far in the 21st century, so on the part of producers and négociants, there had been little need to promote wine tourism.[28]
Author note
This industry note was prepared by Professors Armand Gilinsky, Jr. and Tom Atkin, and Stephanie Bayar, MBA student, Sonoma State University, for the purposes of class discussion, not to illustrate effective or ineffective handling of an administrative situation. Development of this note was supported by the F. J. Korbel and Bros. Professorship in Wine Business at Sonoma State University. The authors are grateful to the editors and anonymous reviewers of the WBCRJ for their developmental comments and to Nicole Hitchcock, Head Winemaker, J Wines, and David Menival, Crédit Agricole Nord Est, for reviewing several earlier drafts of this note and providing their industry insights.
Author’s personal conversation on September 14, 2019 and e-mail correspondence on January 29, 2020 with David Menival, Crédit Agricole Filière Champagne, regional director for Champagne and adjunct lecturer, Burgundy Business School.
Source: Statista, retrieved from: https://www.statista.com/statistics/961279/market-shares-of-leading-fine-wines/
Author’s personal conversations over September 14–16, 2019, with David Menival, Crédit Agricole Filière Champagne, regional director for Champagne and adjunct lecturer, Burgundy Business School, and with Professor Natalie Spielmann at the NEOMA Business School.
Spielmann & Williams (2018). Champagne Cattier: The diversification challenge. Ivey Business School Foundation, 4–6.
Baldy (1997). The University Wine Course, The Wine Appreciation Guild, South San Francisco, CA.
Schmitt (2019). ‘Problems’ in France to blame for Champagne decline, the drinks business. Retrieved April 1, 2019, from: https://www.thedrinksbusiness.com/2019/03/problems-in-france-to-blame-for-champagne-decline/
Euromonitor International (2019). Alcoholic Drinks: Euromonitor (from trade sources/national statistics). Retrieved March 29, 2019.
Declerck & Cloutier (2010). The financial value of corporations in a cobweb economy. International Journal of Wine Business Research, 22(3), 269–287.
Charters et al. (2013). Value in the territorial brand: The case of champagne. British Food Journal, 115(10), 1505–1517.
Anon (2018a). BMI France Food & Drink Report - Q3 2018. (2018). London: Fitch Solutions Group Limited. Retrieved from ABI/INFORM Collection.
McCoy (2018). Is climate change coming for your champagne? Bloomberg.Com, N.PAG.
Woodard (2019). What does the future hold for Champagne? - Research in focus. Aroq - Just-Drinks.Com (Global News), N.PAG.
Morton (2019). “We are already producing Champagne in a climate that’s different from our fathers’” - just-drinks speaks to the Comite Champagne." Aroq - Just-Drinks.Com (Global News), N.PAG.
Willcox (2017). Climate Change Is Putting English Sparkling Wine on the Map. Vinepair, N.PAG. Retrieved April 15, 2020, from: https://vinepair.com/articles/climate-change-is-putting-english-sparkling-wine-on-the-map/
Penet, A., owner of La Maison Penet, A., owner of La Maison Penet. Personal correspondences with author during 2018 and 2019.
Engelbrecht et al. (2014). Region-of-origin (ROO) certification as marketing strategy in the South African wine market, International Journal of Wine Business Research, 26(2), 139–162.
Atkin & Johnson (2010). Appellation as an indicator of quality, International Journal of Wine Business Research, 22:1, 42–61; Atkin, T.S., Wilson, D., Thach., L., & Olsen, J. (2017). Analyzing the impact of conjunctive labeling as part of a regional branding strategy, Wine Economics and Policy, dx.doi.org/10.1016/j.wep.2017.10.003.
Verdonk et al. (2017). Toward a model of sparkling wine purchasing preferences. International Journal of Wine Business Research, 29(1), 58–73.
Woodard (2019), Nine Spanish producers to leave the Cava DO. Decanter, Retrieved September 30, 2019, from: https://www.decanter.com/wine-news/nine-spanish-producers-to-quit-cava-do-408598/#z2Y9wukAgiJVKh2D.99
Author’s personal conversation with Ton Mata, managing director of Recaredo, in Sant Sadurni d’Anoia, Spain, September 23, 2019.
Wine Institute (2018). Sparkling wine fact sheet. Retrieved May 27, 2019, from: https://www.wineinstitute.org/resources/winefactsheets/article92
Both definitions are according to the United States Wine Wine Institute (2018).
Schmitt (2019). ‘Problems’ in France to blame for Champagne decline, the drinks business. Retrieved April 1, 2019, from: https://www.thedrinksbusiness.com/2019/03/problems-in-france-to-blame-for-champagne-decline/
Anon (2018b). Food & Beverage Report: Europe, August 2018, available from Mergent Online.
As reported by Todorov, K. (2019, October 3). Moët Hennessy North America President and CEO predicts good future for wine despite headwinds. Wine Business Online. Retrieved June 21, 2020 from: https://www.winebusiness.com/news/?go=getArticle&dataId=220438
MacMillan (2019) State of the Wine Industry Report, 2019. Silicon Valley Bank, 47–48. Retrieved June 5, 2019, from: https://www.svb.com/wine-report
Charters & Menival (2011). Wine tourism in Champagne. Journal of Hospitality & Tourism Research, 35(1), 102–118.
Schmitt (2019). ‘Problems’ in France to blame for Champagne decline, the drinks business. Retrieved April 1, 2019, from: https://www.thedrinksbusiness.com/2019/03/problems-in-france-to-blame-for-champagne-decline/